


“Make it work, make it right, make it fast.” — Kent Beck
Beck’s three-step rule was about code quality, but it cuts even deeper when you’re wiring AI into durable workflows. The “make it work” part is easy — you can route everything through an LLM and it’ll work. “Make it right” is where the architecture actually lives. The Enterprise’s computer doesn’t decide whether to lower shields in hostile territory — that’s Picard’s call. But it calculates the shield power distribution, the precise mass of the anomaly, and the warp trajectory to intercept it in time. Deterministic. Exact. Millisecond-fast. Different tools for fundamentally different kinds of work.
I keep getting the same question from developers building AI-native systems: where does the line go between what the AI does and what code does? Not philosophically — practically. When an alert fires and someone has to figure out what’s broken, gather data from three sources, loop in a third party, apply a mitigation, and check whether it worked — where exactly does the AI go in that flow, and where does it stay out?
This post answers that question with a real, running demo. Not a toy example — a nine-executor durable workflow, running on a live DTS container via Aspire, with screenshots to prove it.
But here’s what makes this more than another workflow post. When the AI side of that line needs more than a single model call — when you actually need judgment, specialization, memory of past decisions, the way a real on-call expert team does — what you’re reaching for isn’t just “an LLM.” It’s a team with charters, routing, and history. That’s Squad: named agents with specialized context, decision records, multi-repo knowledge, and a track record of handling the messy reasoning parts of engineering work — the stuff that doesn’t reduce to a single well-posed question.
Squad’s normal home is its own CLI process, its own runtime, its own event loop. Microsoft Agent Framework lives in its own world — AIAgent base types, typed executors, durable orchestration. Two excellent worlds that didn’t know each other existed.
This post is also the story of how we bridged them. Squad now wears the MAF uniform. It’s an AIAgent you drop into any durable workflow alongside deterministic executors and DTS-backed checkpointing. Picard delegates to the expert squad; the expert squad plugs into the same workflow engine as the database lookups and the external-comms calls; the whole thing survives process restarts because DTS has the checkpoint. One ship, one chain of command, one Aspire dashboard.
It’s Not Science Fiction Anymore — This Is Your On-Call Rotation
Picture the scene. A latency alert fires from your payments service at 02:17. Not a clean “connection refused” — a messy, ambiguous signal. Error rate at 14.3%. p99 latency at 8,240ms. Three overlapping alerts: database connection pool saturation, payment-gateway external latency elevated, orders table lock contention. One enterprise customer with a two-hour SLA, and the clock is already running.
Here’s the full on-call workflow that needs to happen:
- Read the alert and form a hypothesis. What kind of problem is this, actually? Database? Network? Auth? Payments? Not always obvious from the raw signal.
- Gather the evidence. Fetch current metrics, look up the customer’s tier and SLA, pull recent alert correlation, reach out to the customer for reproduction steps, query the third-party payment gateway status page.
- Route to the right specialist. If the root cause is database connection pool exhaustion, you want database-specific investigation and runbooks. If it’s the payment gateway, you want payments-specific context. Auth issues require a completely different mental model.
- Apply mitigation. Run the appropriate runbook for the affected subsystem.
- Check whether it worked. Review all accumulated evidence — triage, metrics, customer comms, subsystem analysis, mitigation result. If the diagnosis is still inconclusive, loop back and gather more data. But not forever.
None of that is exotic. That’s on-call work in any service with a meaningful SLA. Some of those steps require judgment over ambiguous information. Some require precise lookups from known sources. Some require communicating outside your own systems. And some require checking your own work.
The question isn’t “should I use AI for incident response?” The question is: which steps earn an LLM call, and which ones are just expensive glorified if statements?
The All-AI Trap
The tempting answer is: run the whole flow through a single AI agent. Feed it the alert, the metrics, the customer record, the third-party status, and let it reason about everything.
Beautiful, for about five minutes.
Then you check the bill.
Every step in that flow above has a radically different cost profile. Step 1 — “read the alert and form a hypothesis” — genuinely requires reasoning over a messy description with no predefined answer. That’s AI territory. Step 2 — “fetch the customer’s SLA tier from the database” — is a row lookup. The answer is 2h or 4h or Best-effort, it’s in the database, and it’s always exact. Running it through an LLM burns input tokens, output tokens, model inference time, and a slice of your TPM quota to retrieve something a C# method can return in six milliseconds.
Here’s the math. If this workflow runs 10,000 times a day and you collapse the three deterministic gathering steps (customer lookup, metrics fetch, alert correlation) into plain C# instead of routing them through the AI, you’ve eliminated 30,000 LLM calls per day. That’s your rate-limit headroom, a non-trivial line item on your inference bill, and between 1.5 and 9 seconds of latency reduction — every single run.
And it gets worse than cost. In Part 13 (agent memory), I noted that the more your agent remembers, the less room it has to think. That same force operates here. Routing everything through one big AI agent fills the context window with data lookups the model never needed to be involved with. You’ve used up reasoning capacity on retrieval. The actual judgment call — “which subsystem does this point to?” — is buried in noise the model gathered about itself.
There’s also the non-determinism problem. “Look up the customer’s SLA tier” is not a reasoning problem. Routing it through an LLM introduces the possibility of a wrong answer where the right answer was always deterministic. You’ve made the system less correct and more expensive simultaneously. And when a regulator asks “why did your system apply this runbook to this customer?” — “the AI decided” is not the answer they’re looking for.
Use AI for judgment. Use code for everything else.
The Enterprise Runs on Both
Here’s the mental model I keep coming back to.
Picard decides whether to engage. The ship’s computer calculates whether it’s possible. Picard evaluates the Cardassian offer of alliance. The computer runs the sensor sweep that tells him whether their weapons are charged. Spock provides the judgment the computer can’t — context, ethics, experience. Neither replaces the other. Neither tries.
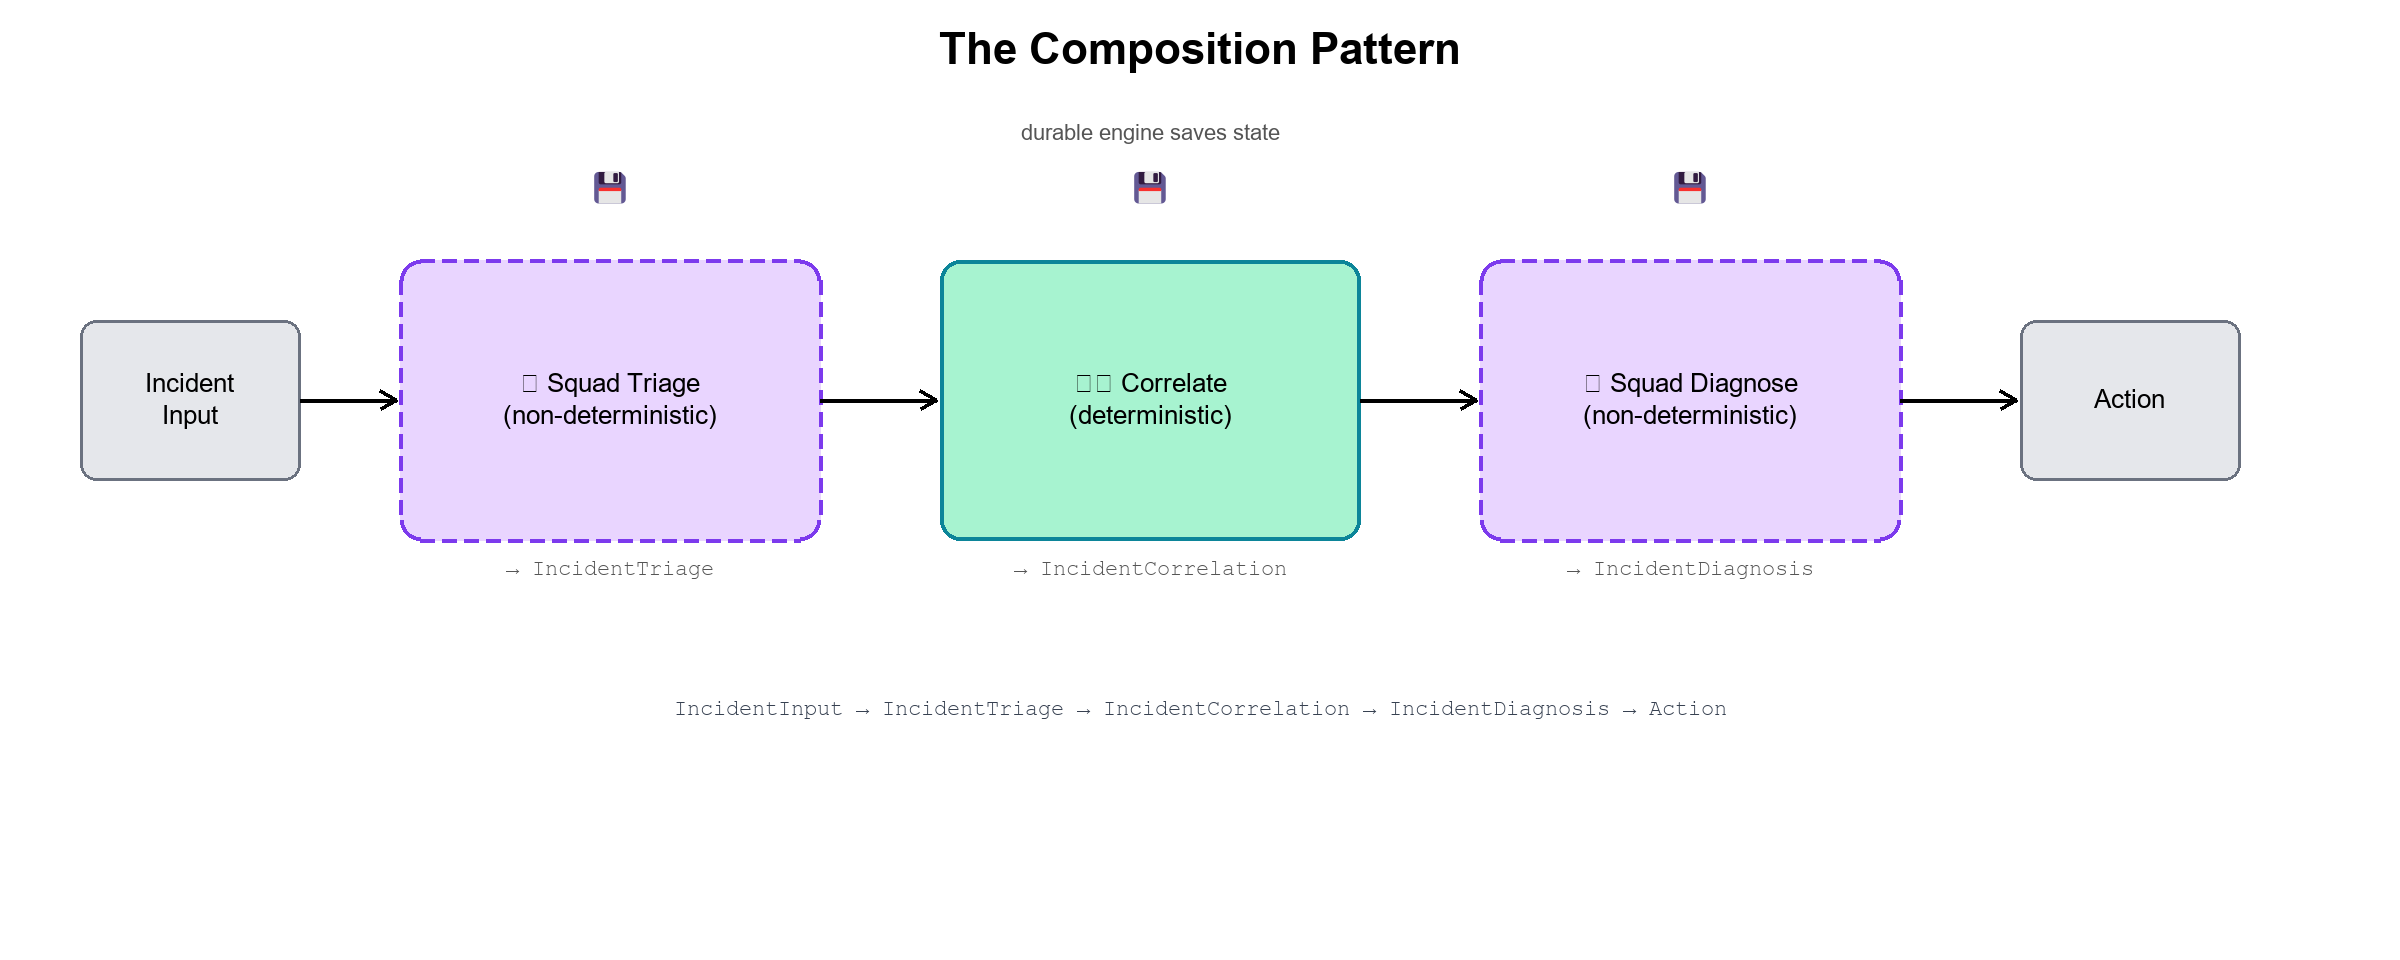
The pattern is: AI does the judgment call. Code does the data gathering. AI does the judgment call again, but now with curated, pre-gathered evidence instead of raw noise. The composition is deliberate — each tool handles what it’s actually good at, and the output of one step becomes a typed, structured input to the next.
That division of labor is the architecture this post is about. It shows up clearly in incident response, but it’s the same pattern in compliance review, content moderation, financial risk — anywhere judgment and precise retrieval need to interleave. AI and code, composed deliberately. Not AI or code.
Squad, Now Wearing the MAF Uniform
MAF gives you a beautifully clean AIAgent abstraction: any class that extends it can be dropped into a workflow executor, passed to another executor’s constructor, composed with conditional edges, and have its session checkpointed across process restarts by DTS. The trick is making Squad — which normally lives in the CLI, driving its own event loop — be one of those agents. That’s what SquadAgent.cs in the demo does.
The class declaration is the whole story in one line:
1
2
3
4
5
6
7
8
9
10
11
12
13
// SquadAgent.cs — class declaration
internal sealed class SquadAgent : AIAgent, IAsyncDisposable
{
    private AIAgent? inner = null;
    private CopilotClient? copilotClient = null;

    public SquadAgent(
        string id,
        string name,
        string description,
        bool traceEvents = false,
        string? tracePath = null) { ... }
}
SquadAgent extends AIAgent from Microsoft.Agents.AI. Internally it holds a lazily-initialized GitHubCopilotAgent from Microsoft.Agents.AI.GitHub.Copilot — the package that wraps GitHub Copilot SDK sessions and exposes them behind the standard AIAgent interface. EnsureInnerAsync is the lazy initializer: it creates a CopilotClient, starts it, and wraps it in a GitHubCopilotAgent configured to route requests to the "Squad" agent:
1
2
3
4
5
6
7
8
9
10
11
12
13
14
15
16
17
18
19
20
21
22
23
24
// SquadAgent.cs — lazy Copilot SDK initialization
private async ValueTask<AIAgent> EnsureInnerAsync(CancellationToken cancellationToken)
{
    if (inner is not null)
    {
        return inner;
    }

    copilotClient = new CopilotClient();
    await copilotClient.StartAsync(cancellationToken);

    inner = new GitHubCopilotAgent(
        copilotClient,
        new SessionConfig()
        {
            Agent = "Squad",
            OnPermissionRequest = PermissionHandler.ApproveAll,
            OnEvent = traceEvents ? TraceCopilotEvent : null,
            Streaming = traceEvents,
            IncludeSubAgentStreamingEvents = traceEvents
        });

    return inner;
}
Every AIAgent override — CreateSessionCoreAsync, RunCoreAsync, RunCoreStreamingAsync — delegates through to this inner GitHubCopilotAgent. The MAF workflow engine sees a standard AIAgent. Squad is on the other end.
The non-trivial part is durability. When DTS checkpoints a workflow mid-run, the MAF engine calls SerializeSessionAsync to capture session state; when the workflow resumes after a crash or restart, it calls DeserializeSessionAsync to restore it. SquadAgent passes both operations through to the inner agent — which means the Copilot SDK session itself is part of the checkpoint:
1
2
3
4
5
6
7
8
9
10
11
12
13
14
// SquadAgent.cs — session checkpoint/restore for DTS durability
protected override ValueTask<JsonElement> SerializeSessionCoreAsync(
    AgentSession session,
    JsonSerializerOptions? jsonSerializerOptions = null,
    CancellationToken cancellationToken = default) =>
    (inner ?? throw new InvalidOperationException("Create a SquadAgent session before serializing it."))
        .SerializeSessionAsync(session, jsonSerializerOptions, cancellationToken);

protected override ValueTask<AgentSession> DeserializeSessionCoreAsync(
    JsonElement serializedState,
    JsonSerializerOptions? jsonSerializerOptions = null,
    CancellationToken cancellationToken = default) =>
    (inner ?? throw new InvalidOperationException("Create a SquadAgent session before deserializing it."))
        .DeserializeSessionAsync(serializedState, jsonSerializerOptions, cancellationToken);
This is why the DTS timeline can show three full loop iterations across a 117-second run without re-running the earlier triage step: Squad’s session was checkpointed alongside the MAF workflow state. Process restarts between loop iterations just mean DTS replays from the last checkpoint — Squad session included.
Once Squad is a MAF AIAgent, every composition pattern in the MAF docs works with Squad as a participant: sequential workflows, fan-out/fan-in, conditional edges, human-in-the-loop, distributed runtime. The incident workflow below is one example. The same SquadAgent drops equally cleanly into an Azure Function, a Container App, or any other host where you can run a MAF workflow — if MAF can orchestrate it, Squad can be the AI side of it.
The Real Demo: A Durable Incident-Response Workflow
The squad-agent-framework-demo implements this as a complete, runnable incident-response workflow. Nine executors. AI where it earns it. Pure C# where it doesn’t. DTS backing every step. Here’s the full workflow graph from the source comments:
1
2
3
4
5
6
7
triage
  └──► enrich  ◄────────────── loop-back (NeedsMoreInvestigation && iter < 3)
         └──► externalComms                                          ▲
                ├──► [Database]   databaseSquad ─┐                  │
                ├──► [Network]    networkSquad  ─┤                  │
                ├──► [Auth]       authSquad     ─┼──► mitigate ──► diagnose
                └──► [Payments]   paymentsSquad ─┘
AI triage. Deterministic enrichment. Deterministic external comms. Dynamic routing to one of four specialist squads. Deterministic mitigation. AI diagnosis with a capped loop. Let’s look at the moments that matter.
The companion repo follows a standard .NET solution layout under src/. The Aspire host lives in src/AppHost/ and orchestrates everything you see in the dashboard — DTS container, OTLP wiring, environment injection. The demo workflow itself is in src/Demo/, organized into Workflows/ (the durable orchestration), Agents/ (the SquadAgent MAF wrapper), Subsystems/ (the four routed specialist squads), Models/ (the typed contracts flowing between executors), MockServices/ (the stand-ins for external systems), and Infrastructure/ (shared runtime wiring). If you’re browsing the repo cold, start with Workflows/IncidentExample.cs.
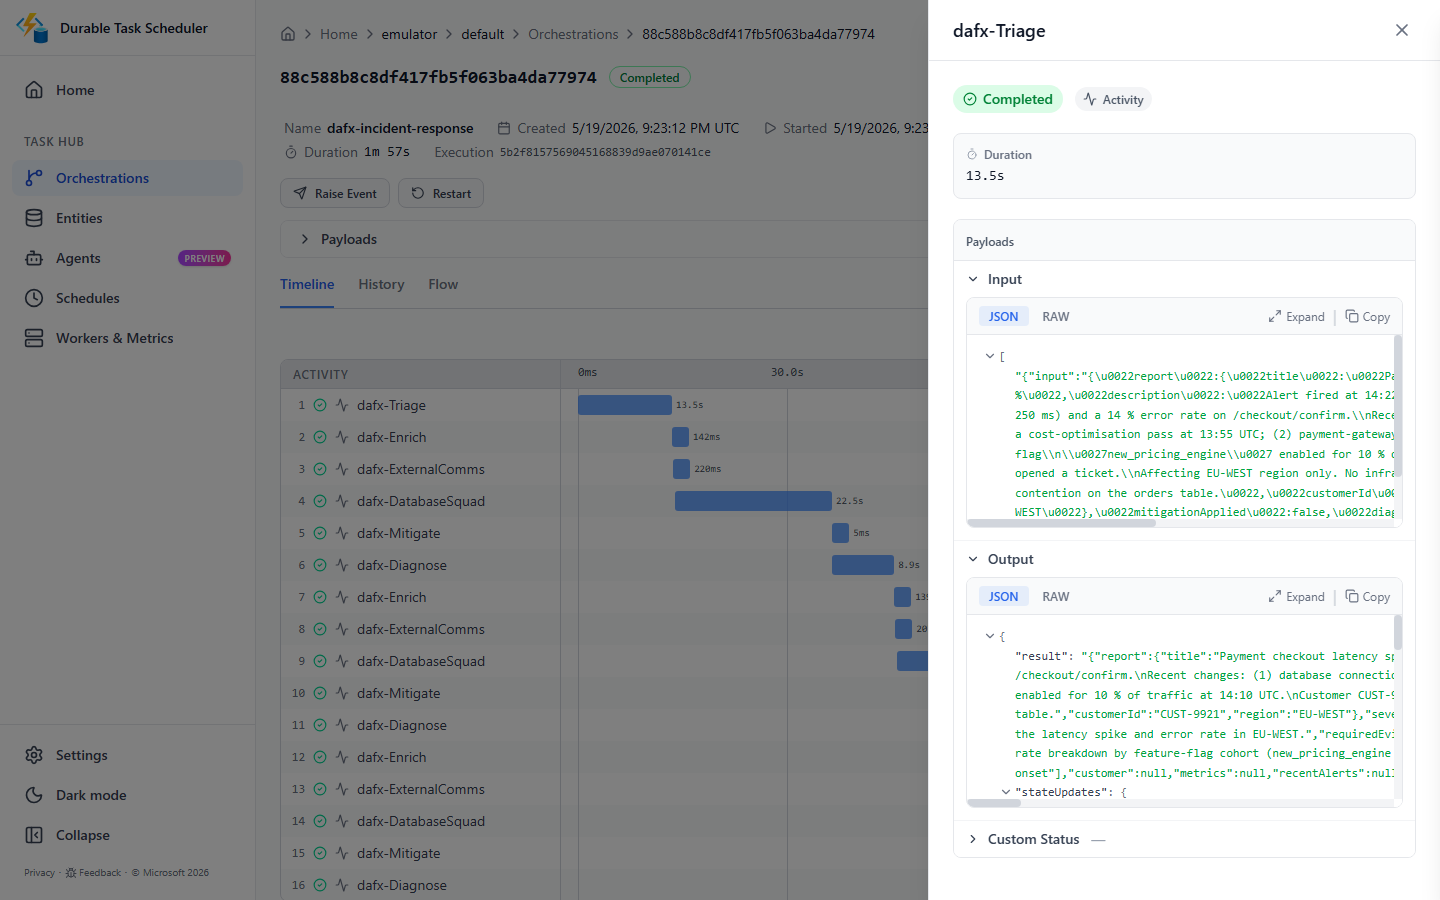
Step 1: AI Triage
An Executor<TIn, TOut> is the fundamental unit of a MAF workflow — a class that receives a typed input, does work (AI or deterministic), and returns a typed output. All nine steps in this workflow are plain Executor<,> subclasses. No magic, no framework-specific boilerplate beyond the base class.
The TriageExecutor is the first one. It reads the raw incident context and asks the AI squad to produce a structured verdict: which subsystem, what severity, an initial hypothesis, and what evidence to gather.
1
2
3
4
5
6
7
8
9
10
11
12
13
14
15
16
17
18
19
20
// IncidentExample.cs — TriageExecutor
internal sealed class TriageExecutor(AIAgent squad)
    : Executor<IncidentWorkflowContext, IncidentWorkflowContext>("Triage")
{
    public override async ValueTask<IncidentWorkflowContext> HandleAsync(
        IncidentWorkflowContext ctx, IWorkflowContext context, CancellationToken ct = default)
    {
        var response = await DemoRuntime.RunAgentAsync(squad, $"""
            Analyze the following incident report and triage it.
            Title: {ctx.Report.Title}   Region: {ctx.Report.Region}
            Description: {ctx.Report.Description}
            Respond:
            Severity: <Sev1|Sev2|Sev3>
            Subsystem: <Database|Network|Authentication|Payments>
            Hypothesis: <one sentence>
            RequiredEvidence: <comma-separated list>
            """, ct);
        return ParseTriage(ctx, response);
    }
}
(DemoRuntime is the small static helper class in Infrastructure/DemoRuntime.cs that all the AI executors call through. It provides CreateSquad() — which bootstraps a SquadAgent and wraps it in an AgentHandle — and RunAgentAsync(), which opens a session, fires a single prompt, and hands back the plain-text response. One line in every executor instead of session-setup boilerplate repeated everywhere.)
The AI does what it’s good at: reasoning over an ambiguous description with no predefined answer key. The output — Subsystem, Severity, Hypothesis, RequiredEvidence — gets stamped onto the shared IncidentWorkflowContext record and flows to the next step as typed data.
Step 2: Deterministic Enrichment (No LLM)
The EnrichExecutor runs next. It already has the triage verdict. Now it gathers the facts: customer tier and SLA from your own systems, a metrics window (error rates, p99 latency, top error strings), and correlated recent alerts. Pure C#. Zero LLM involvement. Three parallel async calls.
1
2
3
4
5
6
7
// IncidentExample.cs — EnrichExecutor.HandleAsync (no LLM)
var customerTask = MockCustomerService.GetCustomerAsync(ctx.Report.CustomerId, ct);
var metricsTask  = MockMetricsService.GetMetricsWindowAsync(ctx.Report.Region, ct);
var alertsTask   = MockAlertCorrelationService.GetRecentAlertsAsync(ctx.Report.Region, ct);

await Task.WhenAll(customerTask, metricsTask, alertsTask);
return ctx with { Customer = await customerTask, Metrics = await metricsTask, RecentAlerts = await alertsTask };
No model, no tokens, no rate-limit exposure. Deterministic every time. The Mock* services simulate real network latency (80ms, 120ms, 60ms respectively) so the DTS timeline looks realistic. In production, each mock becomes a real HttpClient call to your customer platform, metrics store, or alert correlation service — the shape of the executor doesn’t change.
Step 3: Conditional Routing — The Routing Table That Thinks
After the external communications step — which reaches out to the customer for reproduction context and queries the third-party payment gateway status page, also pure C# — the workflow has a triage verdict with a populated Subsystem field. That field determines which specialist squad handles the case.
1
2
3
4
5
6
7
8
9
// IncidentExample.cs — WorkflowBuilder conditional routing
.AddEdge<IncidentWorkflowContext>(externalCommsBinding, databaseBinding,
    ctx => ctx?.Subsystem == "Database")
.AddEdge<IncidentWorkflowContext>(externalCommsBinding, networkBinding,
    ctx => ctx?.Subsystem == "Network")
.AddEdge<IncidentWorkflowContext>(externalCommsBinding, authBinding,
    ctx => ctx?.Subsystem == "Authentication")
.AddEdge<IncidentWorkflowContext>(externalCommsBinding, paymentsBinding,
    ctx => ctx?.Subsystem == "Payments")
The edge conditions are deterministic predicates over an AI-derived value. Starfleet routes the away team to the right specialist: the medical team for biological anomalies, engineering for warp-core issues, security for hostile incursions. The routing decision itself is just a C# lambda. The judgment that produced the value being compared — the triage classification — was AI.
This is the composition doing exactly what it should. The AI contributes the classification; code acts on it precisely and predictably. You could write a unit test for the routing logic right now, against any classification the AI might produce.
The Loop Without the Death Spiral
After the specialist squad runs and mitigation is applied, the DiagnoseExecutor reviews everything — all accumulated triage data, metrics, customer communications, subsystem analysis, and mitigation result — and makes a judgment call: resolved, or does this need another look?
1
2
3
4
// IncidentExample.cs — diagnose loop-back edge
.AddEdge<IncidentWorkflowContext>(diagnoseBinding, enrichBinding,
    ctx => ctx?.DiagnosisStatus == "NeedsMoreInvestigation"
           && ctx.DiagnosisIteration < MaxDiagnosisIterations)
MaxDiagnosisIterations is 3. That’s it. That’s the whole gate.
The AI can propose another investigation cycle — and can even refine the hypothesis for the next enrichment pass, which flows back into the triage context. But it cannot run one if the counter is at cap. The deterministic edge condition enforces it. The AI proposes. Code decides whether the proposal is allowed.
In B’Elanna’s real run of this demo, the loop fired all three iterations — which is exactly what you’d want to see from a complex payment-service incident with overlapping database and gateway symptoms. Every iteration was checkpointed. The workflow survived all three passes. DTS knew exactly where each loop iteration stood.
AI agents that retry forever burn money and trust in equal measure. A capped loop is how you let AI iterate without inviting it to talk in circles. The pattern is always the same: AI proposes, deterministic gate caps it.
Subsystem Squads — Specialists From Specialized Repos
Each subsystem squad is its own executor with its own charter. The DatabaseSquadExecutor, NetworkSquadExecutor, AuthSquadExecutor, and PaymentsSquadExecutor each carry a different system prompt tuned to a different set of failure modes.
1
2
3
4
5
6
7
8
9
10
// SubsystemSquads.cs — DatabaseSquadExecutor charter
private const string Charter =
    """
    You are the Database incident-response squad. Your charter:
    - Investigate connection pool exhaustion, lock contention, slow queries,
      and index fragmentation.
    - Correlate database metrics with application error patterns.
    - Recommend precise, read-only diagnostic steps (no schema changes).
    Be concise: 3–5 sentences, focus on the most likely database root cause.
    """;
In the demo, all four squads live in the same project — useful for running and understanding the pattern end to end. But here’s where the architecture becomes genuinely interesting at scale.
A database squad doesn’t just have different configuration. It has different context, different runbook vocabulary, and a different set of people who maintain it and refine it over years of on-call work. In a real organization, each subsystem squad would live in its own repository, with its own Squad routing, its own decisions.md, and its own charter tuned to exactly the failure modes that team has accumulated. The HQ workflow routes the case. The specialist repo owns the resolution. (Part 12 covers the spawn-squad pattern that makes this work in production.)
The HQ workflow doesn’t know how to diagnose a payments problem. It knows how to route the case to the squad that does. The routing is a deterministic predicate — ctx.Subsystem == "Payments". Everything that happens after the route is the specialist’s domain. Starfleet Command doesn’t fix the nacelles. It tells engineering to fix the nacelles, and engineering knows things Starfleet Command doesn’t need to.
This is also the answer to “how do you scale this beyond a single team?” You add more specialist squads. Each one lives in the repo that owns that subsystem. The HQ workflow learns one new conditional edge per squad. The routing stays deterministic. The specialist knowledge stays distributed.
Durable, Because Reality Crashes
A workflow like this can run for two minutes in a demo. In production it might run for twenty — external comms have real latency, the diagnosis loop fires multiple times, the process might restart mid-run. Without durability, any of that means starting over.
The Aspire AppHost wires the DTS emulator container directly:
1
2
3
4
5
6
7
8
// AppHost.cs — DTS container + endpoint injection
var dts = builder.AddContainer("dts", "mcr.microsoft.com/dts/dts-emulator", "latest")
    .WithEndpoint(port: 8080, targetPort: 8080, name: "scheduler", scheme: "http")
    .WithEndpoint(port: 8082, targetPort: 8082, name: "dashboard");

builder.AddProject<Projects.Squad_AgentFramework_Demo>("squad-agent-framework-demo")
    .WithEnvironment("DTS_ENDPOINT", dts.GetEndpoint("scheduler"))
    .WaitFor(dts);
Two lines of AppHost wiring. The DTS_ENDPOINT is injected into the demo project automatically — no manual env var needed. The workflow picks it up, registers with DTS on startup via ConfigureDurableWorkflows, and every executor call becomes a checkpointed DTS activity. If the process restarts between step 5 and step 6, DTS replays from the last checkpoint. The AI steps that already completed don’t re-run. You pay for them once.
Here’s what B’Elanna’s real end-to-end run looked like in the DTS dashboard:
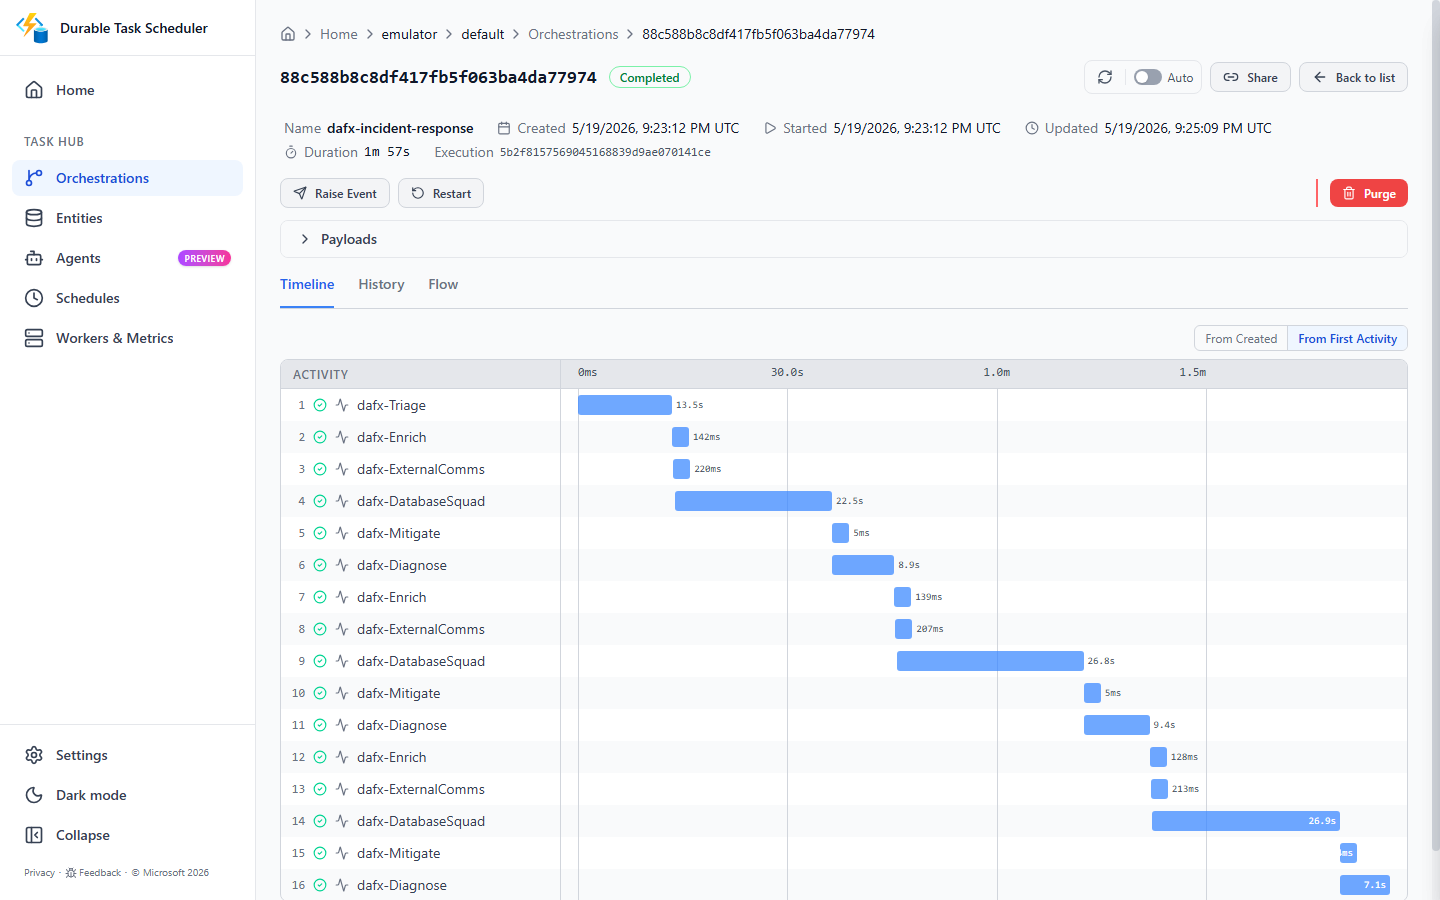
dafx-incident-response. Completed. 1 minute 57 seconds. 16 activities. That’s the full workflow: triage, three enrichment cycles (the loop fired all the way to the cap), external comms, database-squad analysis, mitigation, and the three diagnosis passes — each one a DTS activity.
The timeline makes the loop iterations visible. Each pass through enrich → externalComms → subsystem squad → mitigate → diagnose is its own set of checkpointed activities. If the process had restarted anywhere in that 117 seconds, DTS would have resumed from the last completed activity. No rerun. No data loss. No “oops, the AI triage ran twice and got different subsystem classifications.”
The Durable Task Scheduler post covers the DTS production story. The Microsoft devblogs post on Durable Workflows in Microsoft Agent Framework covers the executor model, workflow builder, and replay semantics in detail — highly recommend reading it alongside this one for the deep mechanics.
Three Layers of Telemetry, One Dashboard
What started as “we wired up OTel, it works” became a genuinely satisfying story about how the Copilot SDK had the observability story all along — we just had to flip three switches and stub our toe on two issues (TLS certs and protocol mismatch).
Layer one is free the moment you run via Aspire AppHost. Aspire injects OTEL_EXPORTER_OTLP_ENDPOINT into every project it manages. The OTel setup in Program.cs picks it up:
1
2
3
4
5
6
7
// Program.cs — OTel SDK registration (layer 1: workflow orchestration)
using var tracerProvider = !string.IsNullOrWhiteSpace(otlpEndpoint)
    ? Sdk.CreateTracerProviderBuilder()
          .AddSource(IncidentExample.DemoActivitySource.Name)
          .AddOtlpExporter()   // reads OTEL_EXPORTER_OTLP_ENDPOINT from env
          .Build()
    : null;
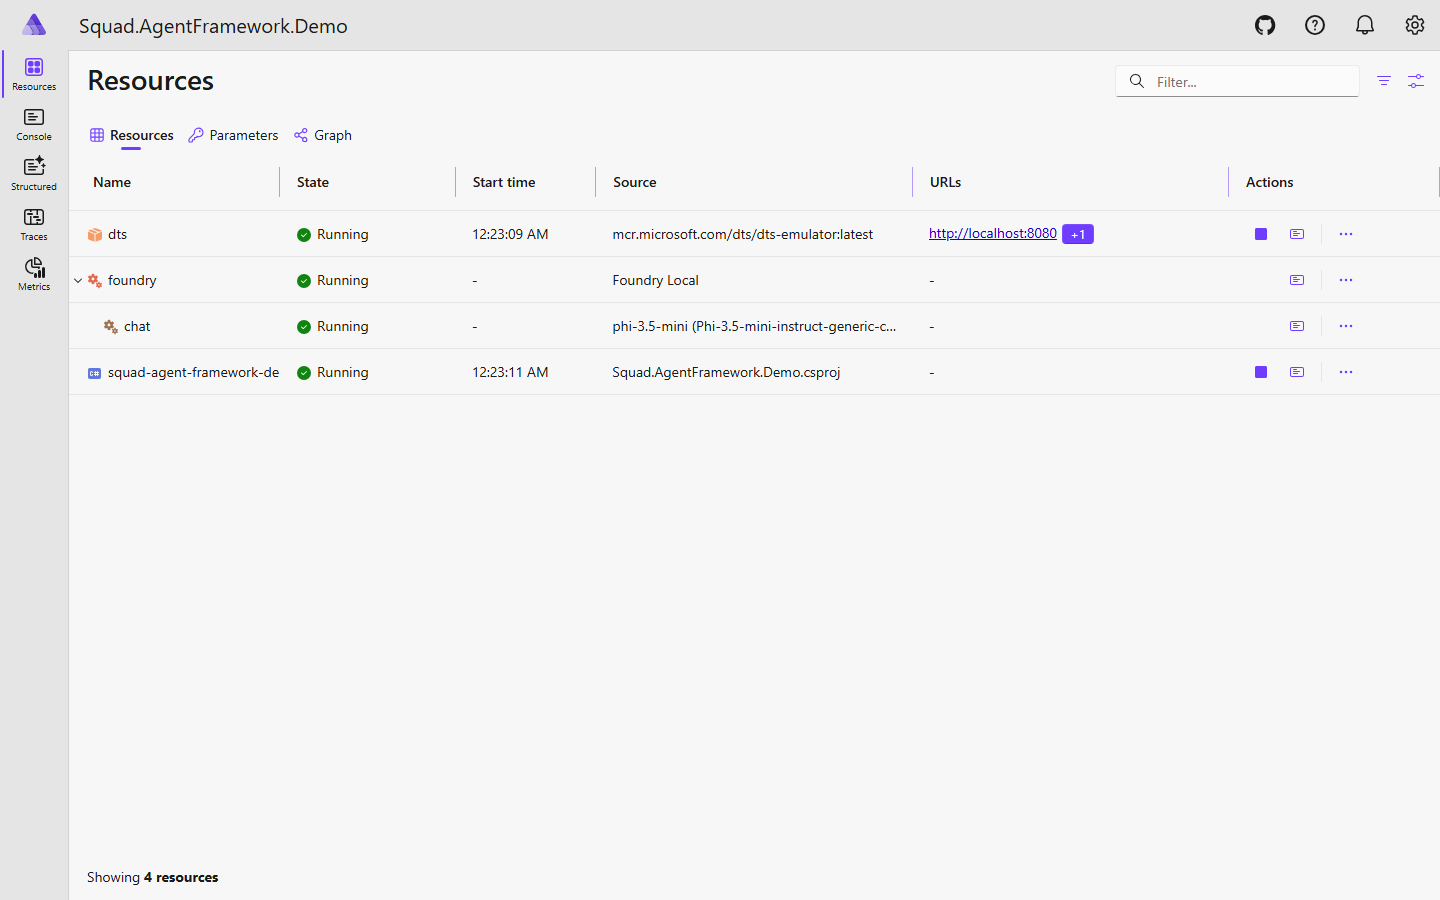
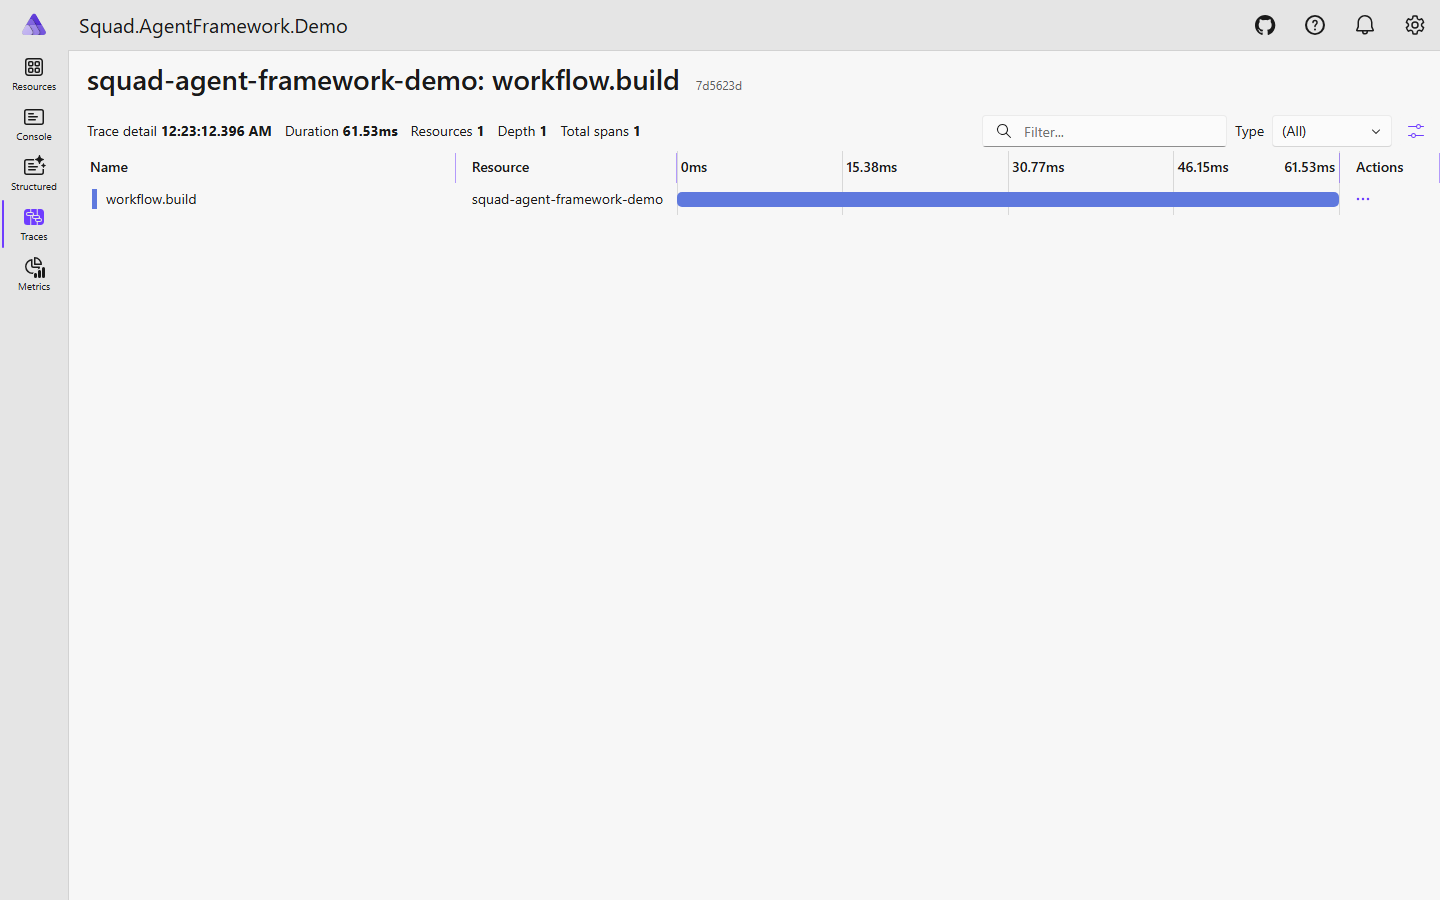
That’s Squad.AgentFramework.Demo — the workflow’s own ActivitySource, emitting the workflow.build trace that shows the full executor chain as it runs. All four resources visible in the same Aspire dashboard from the moment you type dotnet run.
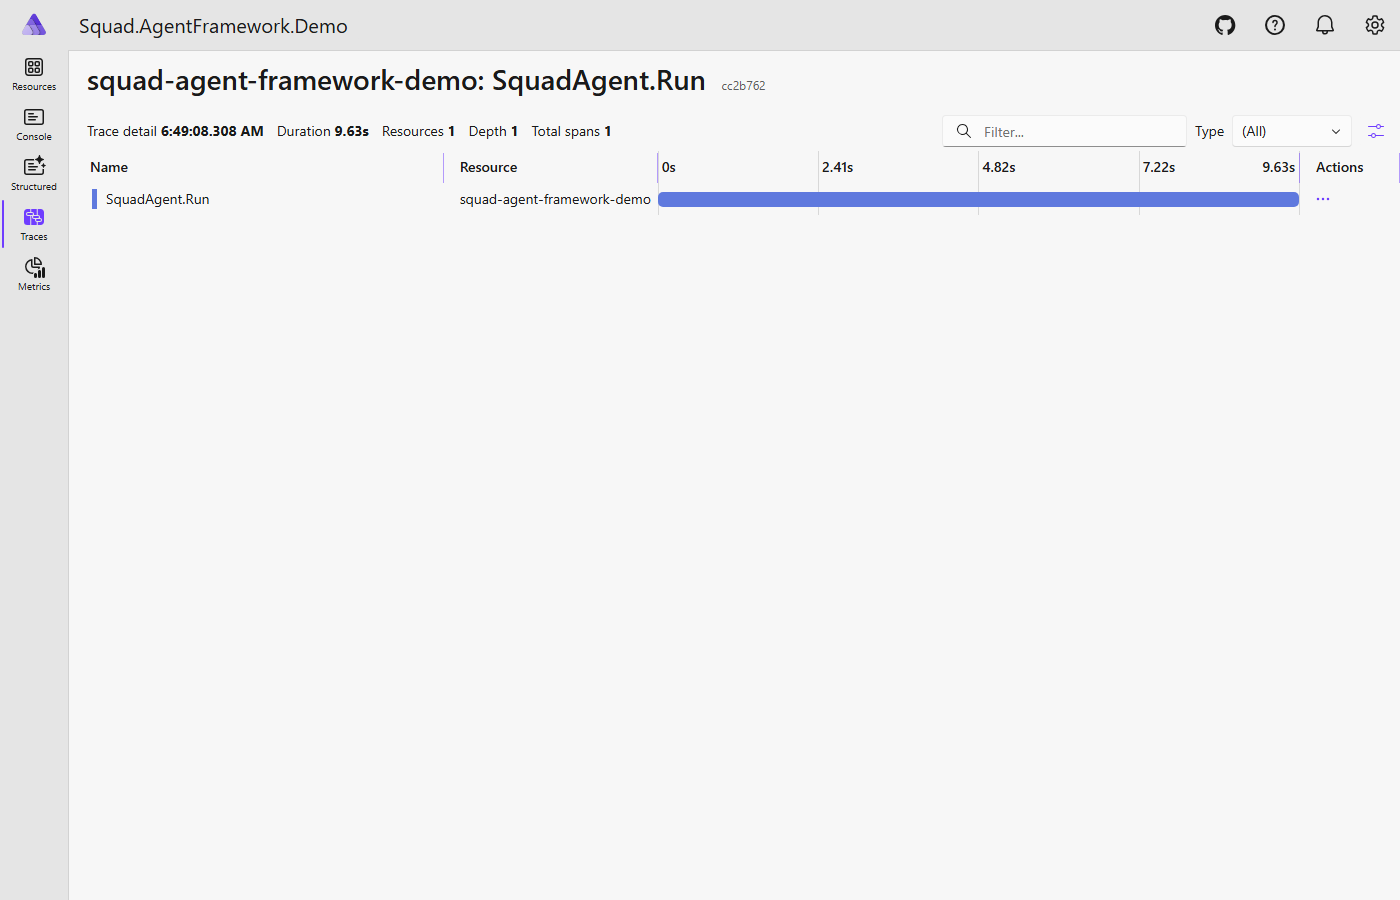
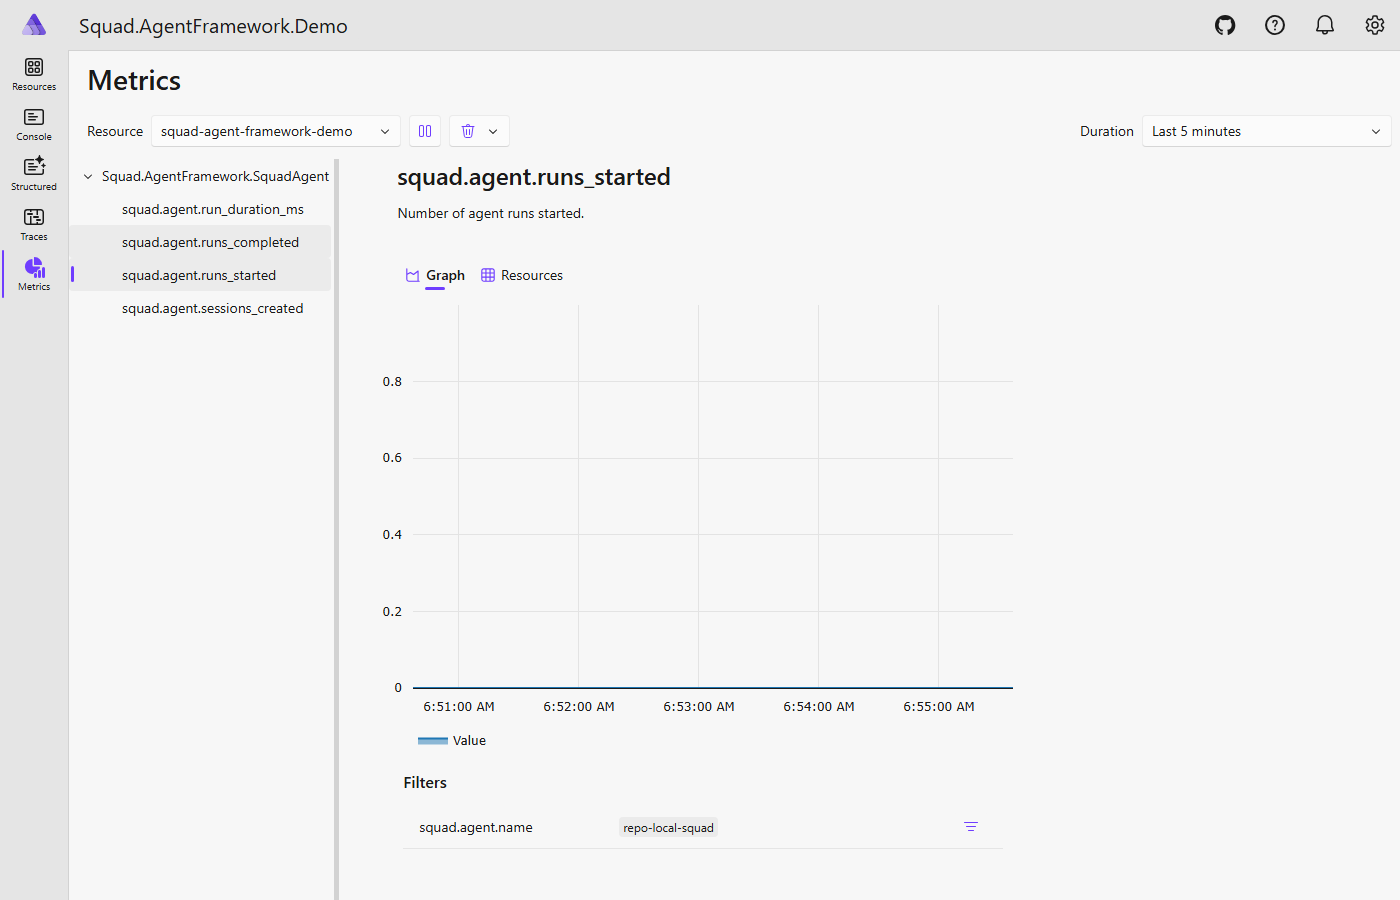
Layer two is the SquadAgent .NET wrapper, which registers its own ActivitySource("Squad.AgentFramework.SquadAgent") and a paired Meter. Every call through the wrapper emits spans — SquadAgent.CreateSession, SquadAgent.Run, session serialize/deserialize across DTS checkpoints — and records metrics: runs_started, runs_completed, run_duration_ms, sessions_created. The wrapper used to run silently: you could see the workflow had a Squad step, but the interior was dark. This layer lit it up.
Layer three is where it gets interesting — and honest. I had been assuming the GitHub Copilot SDK was a black box from an OTel perspective. No way to get spans out of what was happening inside the Copilot CLI sessions. Turns out I was wrong, and I have Laurent Kempé to thank for setting me straight. He pointed me at the Copilot SDK’s own observability docs. The SDK has had built-in OTel support all along. We just had to wire it.
The wiring goes in EnsureInnerAsync, right where the CopilotClient is constructed:
1
2
3
4
5
6
7
8
// SquadAgent.cs — EnsureInnerAsync: wiring the Copilot SDK's native OTel
copilotClient = new CopilotClient(new CopilotClientOptions
{
    Telemetry = new TelemetryConfig
    {
        OtlpEndpoint = otlpEndpoint  // injected from Aspire environment
    }
});
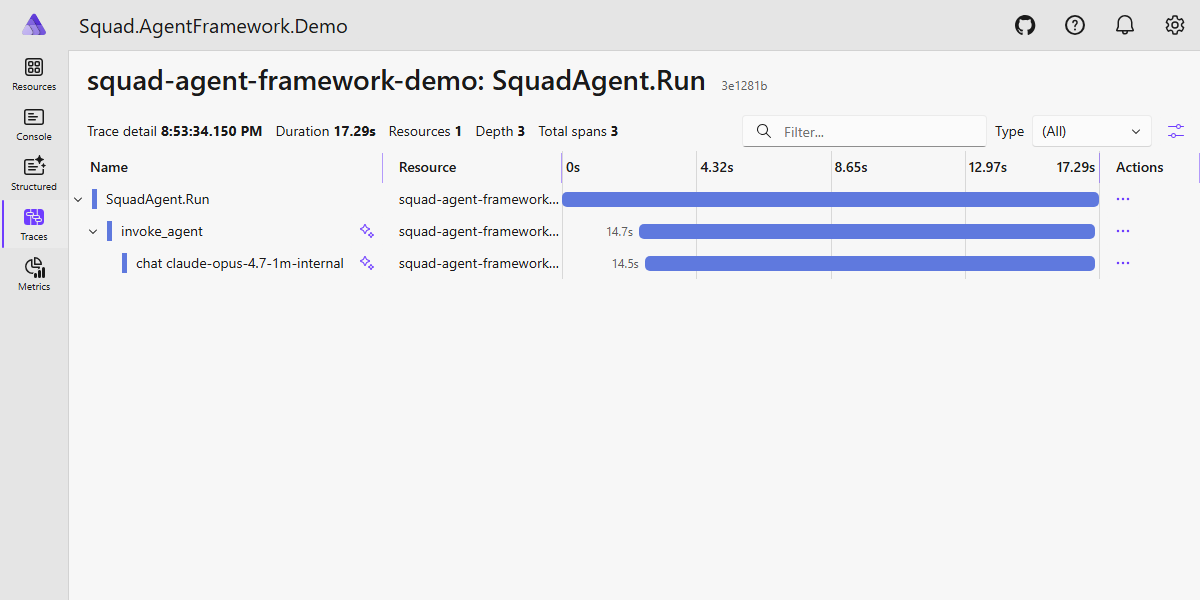
That’s it. The Copilot CLI’s own spans now export via OTLP and link to the .NET parent activity via W3C trace-context propagation. Open a trace in Aspire and you’ll see SquadAgent.Run as the parent, with the Copilot CLI’s internal spans as children underneath.
The story is: the Copilot SDK had this all along — we just had to flip three switches.
A wrinkle worth a paragraph — actually two. Aspire’s local dev environment uses a self-signed TLS certificate for its OTLP endpoint. The .NET OTLP exporter handles this gracefully. The Node.js OTLP exporter inside the GitHub Copilot CLI does not — it rejects the cert and spans stop flowing, silently. You stare at two layers instead of three and wonder what happened.
The second wrinkle is a protocol mismatch. Aspire’s default OTLP endpoint speaks gRPC only. The Copilot SDK’s TelemetryConfig.ExporterType only supports otlp-http (HTTP/protobuf) — it cannot speak gRPC at all. So even after fixing TLS, the SDK’s spans hit a gRPC-only endpoint and silently fail. The fix is enabling both OTLP protocols on the Aspire dashboard: gRPC on port 21021 for .NET, HTTP/protobuf on port 21022 for the Copilot SDK.
1
2
3
4
5
6
7
8
9
// AppHost.cs — dual-protocol OTLP + TLS workaround for local Aspire dev
Environment.SetEnvironmentVariable(
    "ASPIRE_DASHBOARD_OTLP_HTTP_ENDPOINT_URL", "https://localhost:21022");

builder.AddProject<Projects.Squad_AgentFramework_Demo>("squad-agent-framework-demo")
    .WithEnvironment("DTS_ENDPOINT", dts.GetEndpoint("scheduler"))
    .WithEnvironment("NODE_TLS_REJECT_UNAUTHORIZED", "0")        // ⚠️ local Aspire dev only
    .WithEnvironment("COPILOT_OTLP_HTTP_ENDPOINT", "https://localhost:21022")  // SDK → HTTP/protobuf
    .WaitFor(dts);
Both comments are explicit: local Aspire development only. Do not copy this into production config. But you will stub your toe on both issues if you run the demo against a stock Aspire setup and wonder why the third layer of spans never arrives — this is why.
The Aspire Traces tab shows all three source names side by side: Squad.AgentFramework.Demo for the workflow layer, Squad.AgentFramework.SquadAgent for the .NET wrapper layer, and the Copilot CLI’s own spans as children underneath — one unified trace from workflow orchestration down to the model call.
One gap that remains: token-usage counters. Copilot SDK 1.0.0-beta.2 doesn’t yet expose a Usage property on responses, so the wrapper can track run counts and durations but not tokens consumed. I opened bradygaster/squad#1144 to start a conversation with the Squad team about a shared telemetry contract — a common span schema the Squad CLI, the C# wrapper, and any future wrappers could all emit interchangeably. Right now it’s DIY per wrapper; #1144 is where that conversation lives.
Squad also has a native Aspire integration: squad aspire from the CLI spins up the dashboard and wires the OTLP endpoint automatically. Set OTEL_EXPORTER_OTLP_ENDPOINT to point at the same Aspire instance already watching your workflow, and agent spawns, token usage, session metrics, and errors all show up in the same dashboard. The dual-dashboard story (Aspire for .NET spans, DTS dashboard for task-hub orchestration) becomes a four-layer view when you add Squad CLI telemetry on top.
Where the Line Actually Goes — A Cheat Sheet
Every step in a workflow needs to either earn its AI call or prove it doesn’t need one:
| If you’re doing this… | Use this |
|---|---|
| Reading messy evidence and forming a hypothesis | AI Squad |
| Fetching structured data from a known endpoint | Deterministic C# |
| Deciding which specialist team handles this case | Deterministic predicate over AI output |
| Applying a runbook for a known subsystem | Deterministic C# |
| Judging whether mitigation actually worked | AI Squad (with full accumulated context) |
| Deciding whether to loop | AI proposes; deterministic gate caps it |
| Routing to a specialist in a different repo | Conditional edge on AI-derived classification |
| Producing a compliance audit trail | Deterministic at every step |
The pattern scales linearly. Add a new subsystem — add one executor class, one conditional edge, one charter string. Add more enrichment sources — add one async call to the deterministic step. Adjust the loop cap — change one constant. The AI reasoning stays localized to the steps that need it. The deterministic logic stays auditable, testable, and free.
The Bottom Line
Here’s the question I started with: where does the line go between what the AI does and what code does?
The line goes wherever the nature of the work tells you it belongs. Some work requires judgment over ambiguous, unstructured input — that’s AI. Some work requires exact retrieval from known sources — that’s code. Some work requires routing a case to the specialist who knows it — that’s a deterministic predicate over an AI-derived classification. All of it can be wired together in a durable workflow that checkpoints as it goes, loops as needed, and routes to the right expert when it needs to escalate.
The AI-native ops team of the near future doesn’t build one giant all-knowing incident-response agent and pray for the best. It builds a workflow where the right tool handles each step, state is durable across process restarts and loop iterations, and the right squad picks up the right case when it’s time to escalate beyond what the general workflow knows. The triage is AI. The evidence gathering is code. The routing is a predicate. The specialist analysis is AI with curated context. The loop cap is a constant. The whole thing is observable in one Aspire dashboard.
The Enterprise doesn’t run on AI. It doesn’t run on automation. It runs on knowing which one to use, when, and how to wire them together.
Make it so.
Want to Dive Deeper?
- Demo repo: squad-agent-framework-demo — clone it, run
dotnet run --project Squad.AgentFramework.Demo.AppHost, watch the DTS dashboard athttp://localhost:8082 - Durable Task Scheduler: the DTS post — the production story and the war story that started this
- MAF Durable Workflows deep-dive: devblogs.microsoft.com — executor model, workflow builder, replay semantics
- Bulletproof Agents: the official MAF + DTS announcement
- Squad Aspire integration:
squad aspire— spins up the dashboard and wires OTLP in one command - Part 12 — Squads Spawning Squads: fan-out patterns — how multi-repo squad routing works in production
- Part 13 — Agent Memory: the memory tradeoffs — why a growing context window is a reasoning budget problem